More services, but which kind?
Freight services grew far faster than passenger services in the years the records overlap.
This is the service story, not the fleet story. Services per day say nothing about train length, tonnage or capacity.
Daily services, 2014-15 and 2023-24
| Measure | 2014-15 | 2023-24 | Change |
|---|---|---|---|
| Goods services per day | 9,202 | 11,724 | +27.4% |
| Passenger services per day | 13,098 | 13,198 | +0.8% |
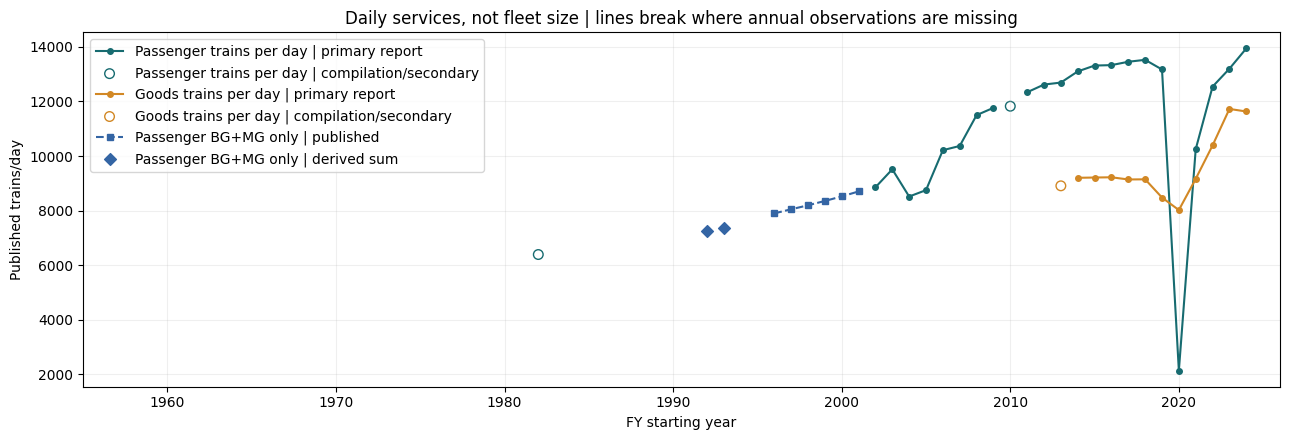
FY2024-25 now has original Year Book evidence for 13,940 passenger and 11,631 goods trains per day. These values were already shown from secondary sources, so this improves source quality and does not add two years of coverage. The passenger total includes narrow gauge and Kolkata Metro. Year Book Passenger Business Table VI also reports 6,089 EMU, 4,287 Mail/Express and 3,564 ordinary/mixed services, which sum to 13,940. A later monthly press-release snapshot is not inserted into the FY series. Source: Year Book 2024-25, printed p5 and p26 / PDF p7 and p28.