Open question. The recovered sources do not support a fair ranking.
The recovered sources do not support a fair all-zone or all-state winner.
State boundaries cut across railway operations, and passenger bookings are not train services. Suburban services can dominate a zone's daily total, but the dates and categories differ. Calling Central or Western Railway the winner from this patchwork would turn a coverage difference into a finding.
Why state rankings are hardA 12 February 2021 parliamentary reply says Indian Railways does not operate services or keep passenger-booking data state by state, because routes cross state lines. PIB reply
What the documents show
11 observations, in source order. They are not sorted and not ranked. Each keeps its own date and scope.
Scope: Zone; BG; passenger-carrying only; components sum to total. Caveat: Older SR profiles show 1257 and 1365 (the latter incl 131 goods + MG 14); undated. Published document text read; page pixels not verified. Source
SR, undated1257
No of trains/day Mail/Exp 245 + Passenger 427 + Suburban 451 + MRTS 134
Scope: Zone; passenger-carrying. Caveat: Undated; do not compare with Z1 as a trend. Published document text read; page pixels not verified. Source
SR, undated1365
No of trains/day BG total (includes Goods 131); MG 14 separate
Scope: Zone; includes goods. Caveat: Includes goods; not comparable with Z1/Z2. Published document text read; page pixels not verified. Source
WR, Undated profile; letter reference April 2022 does not date the counts1907
Scope: Zone; RPF profile. Caveat: Vintage differs from other rows. Published document text read; page pixels not verified. Source
CR, Undated profile; letter reference April 2022 does not date the counts2795
Non-suburban 985; suburban 1810 (no combined total printed)
Scope: Zone; RPF profile; sum is mine. Caveat: 2795 is derived from985+1810, not a printed total; undated counts. No ranking.. Published document text read; page pixels not verified. Source
SCR, 2019-20715
Average passenger trains per day
Scope: Zone; CAG Secunderabad history page. Caveat: Another CAG page gives 744 undated. Published document text read; page pixels not verified. Source
SCR, undated744
Average passenger trains per day
Scope: Zone; CAG Secunderabad page. Caveat: Undated. Published document text read; page pixels not verified. Source
SCR, undated (c.2016)274
Daily average passenger carrying trains
Scope: Scope unclear (zone vs division; MEMU 29 DEMU 37 conventional 49 shown). Caveat: Conflicts with Z6/Z7; not used. Published document text read; page pixels not verified. Source
ER, 20181311
EMU services
Scope: EMU only. Caveat: EMU only; not a zone total. Published document text read; page pixels not verified. Source
NWR, undated (pre gauge conversion)452
Total trains dealt (BG 264 + MG 188)
Scope: Zone page; likely incl goods. Caveat: Undated. Published document text read; page pixels not verified. Source
ECR (Danapur-area division text), undated134
More than average 134 passenger-carrying trains and over 210 freight trains pass
Scope: Division section; not zone. Caveat: Division; not a zone total. Published document text read; page pixels not verified. Source
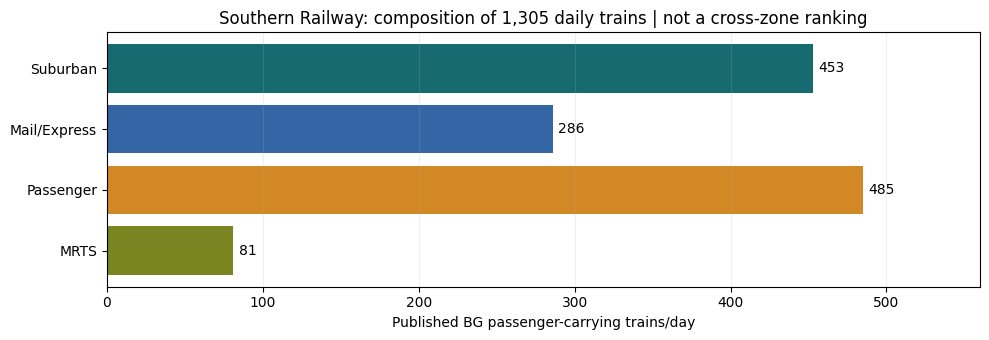
Tap or click to enlarge. One zone on one date: Southern Railway, 30 November 2018. It shows the suburban share. It does not compare zones. Data release v0.2.0. Observed data only; scope breaks kept.
New: goods speed by zone
32 published freight-speed observations cover 16 reporting zones in FY2023-24 and FY2024-25, from one ASS 2024-25 table. Scope: broad gauge, all traction, all goods trains excluding departmental, single and double/multiple lines combined. This can support a scoped freight-performance comparison, not a conclusion about which region has the most passenger trains. Never average zone speeds directly. See goods speed by zone.
A counting rule for a future ranking
Use one dated timetable or service inventory and a stated observation week.
Count weekly scheduled departures divided by 7. Tag seasonal, special and cancelled services separately.
Show suburban and non-suburban panels apart.
Say whether a train belongs to its originating state, every state it serves, or its operating zone. These answer different questions.
No current dated inventory meeting these checks was recovered. The question stays open.