What does safer mean?
Accident counts come from different reporting regimes, so no single 70-year trend is claimed.
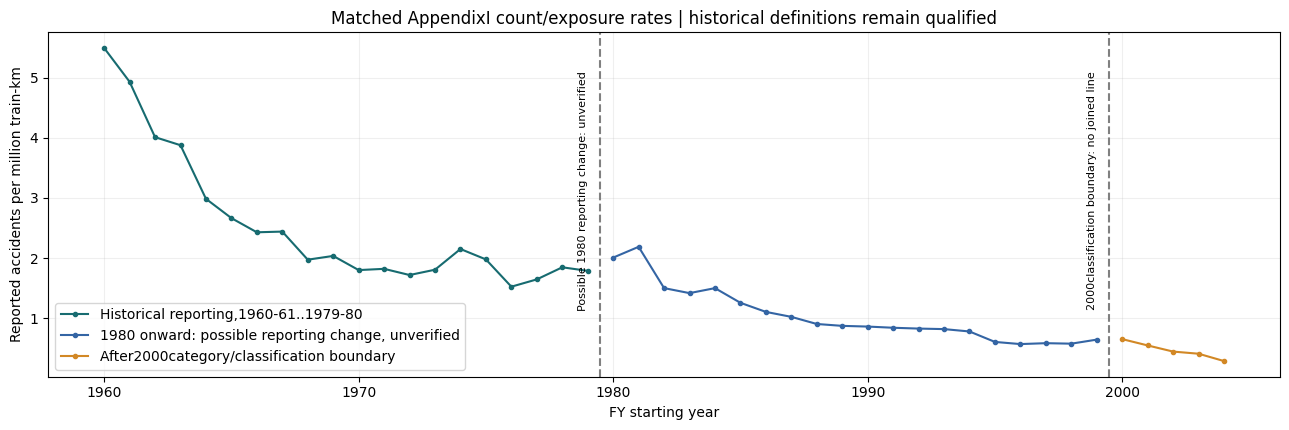
Counts come from different reporting regimes, and the bridge around 1980 and 2000 is still open. No 70-year improvement percentage is claimed.
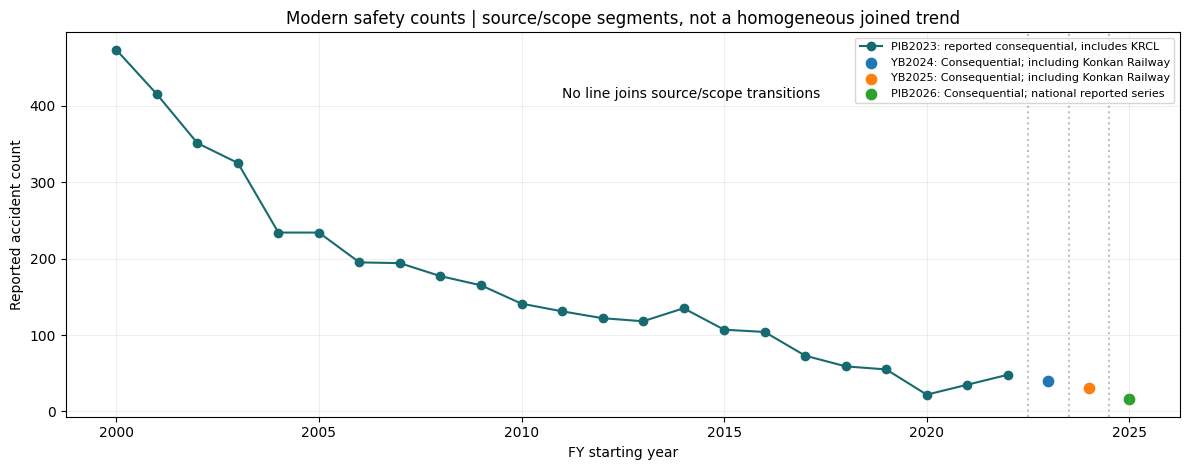
The newest Year Book's five-year table includes Konkan Railway and agrees with the totals already selected: 22, 35, 48, 40 and 31 for FY2020-21 to FY2024-25. FY2024-25 scope is better documented. It is not a newly discovered fall or a revised total. Published 0.03 rates are rounded: do not invert them to infer exposure. The report's narrative on accident causes has inconsistent arithmetic, so it is not used as a causal claim. The category sums were checked against the five totals. Details: Safety, five recent years. Source: Year Book 2024-25, printed p54 / PDF p56.